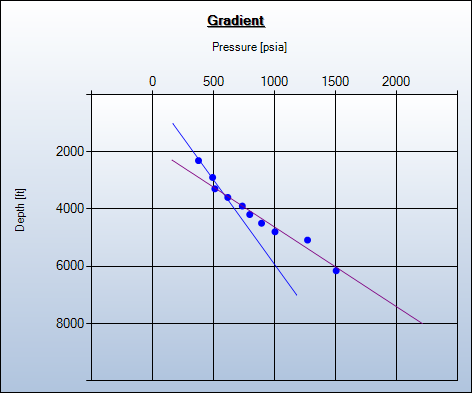
• Think
    Outside
    The box :)

iTest - Welltest Interpretation

iTest is the next generation welltest interpretation package that enable users to design, analyze, process, manage and share welltest data in more ways than ever before, helping organisations to make better and smarter decisions. iTest was developed as a result of the industry need for a tool that combines flexibility and powerful modeling capabilities with affordability and ease of use.
Recently, iTest has undergone significant improvement giving rise to its wide acceptance as commercial application for use by Multinational operators, Marginal operators, Service companies, Consultants, Students, etc.


Modern User Interface

In step with the latest technology, go beyond interpretation...


Senior watch slim, Jaeger Le Coulter Masters Series must not replica watches miss. Jaeger Le Coulter's master series is swiss replica watches an entry - level series in the brand, but it replica watches sale also has a complex style to replica watches online the sky.

Enhanced user experience

iTest simplifies how you access features. The new iTest Application menu replaces the traditional File menu to let you save, share and print your analysis with just a few clicks. With the improved Ribbon, you can access your favorite commands even more quickly by customizing tabs or creating your own to personalize the experience to your work style.

Reduced file sizes

The new iTest file format is a compressed, segmented file format that offers a dramatic reduction in file size and helps ensure that damaged or corrupted files can be easily recovered. Thus, even after importing an enormous amount of data the resulting iTest file size when saved, is relatively small.

Copy/paste

iTest allows you to copy and paste chart directly into any opened analysis or other windows application. Other items such as tables, textboxes, pictures and shapes can also be copied to the clipboard and pasted in any opened analysis window.

Do, undo and redo again!

Whether you are dealing with a complex sequence of data preparation, standard analysis, or formatting, iTest will remember all the actions you have performed and you may choose to undo or redo any action. This allows a new user to try out various options and features bearing in mind that he/she can easily undo/redo his/her actions. This feature has greatly reduced the learning curve.

Analytical Models

iTest has a comprehensive set of tools that allow users to carryout analysis quickly and with ease. iTest provides a wide range of analytical models for well, reservoir and boundary conditions, enabling users to select a large combination of these models in complement of wellbore and skin options.

As the technical literature develops newer models or more appropriate solutions, these are incorporated into the suite of iTest models. At the present the following models are available:

Create Professional Charts

You dona€?t have to be a design expert to create professional-looking charts. Annotations can add interest and emphasis to various parts of your interpretation. Use dozens of available Annotation layouts to transform your interpretation into impressive visuals that better illustrate your ideas.

Tons of Editable Chart Elements!

Start analysing your welltest using iTest.

Not convinced? Therea€?s all this too:

data preocessing

Data Processing

Our easy-to-use a€?Edit Dataa€? module in iTest enable the acquired data to be manipulated, transformed, filtered, processed and applied to the existing knowledge of the well and/or reservoir.

iTest supports loading of unlimited number of data points from several gauges and from a wide range of data sources including ASCII, MS Access, MS Excel, Oracle DB, MS SQL Server and XML. The user can also type the data directly using the keyboard.


Data QAQC & Validation

After the data has been imported into iTest, it is important that the user performs a quality control and check. A typical way of QC is to dynamically generate, for any gauge, a difference plot for an active gauge and a selected reference gauge, this serves a basis for detailed analysis of wellbore effects such as phase segregation, gauge failure, etc.

The principle used by iTest is basically the study of the changes in hydrostatic head between gauge sensing points. This is achieved by taking the difference between a reference pressure (gauge) and the other gauges. Therefore the absolute value difference can be estimated between the individual tools and a quality indicator assigned.

data validation

data preocessing

Classical & Derivative Analysis

A successful well test analysis requires the selection of the most appropriate model to represent the reservoir behavior. The classical plots allow the user to carryout specialized analysis which may be used to supplement/confirm the derivative analysis. In all cases, analysis will generally rely on matching data with generated model response for rate history.

The superposed synthetic pressures are drawn on the same graph as the test data, for comparison of the model to the data. These plots can be displayed on log-log, semilog, or strip plots, and account for the whole flow history. This process of comparing synthetic pressures to measured test pressure is also known as history matching, and can be done manually or automatically.


Automated Model Fitting

In iTest, users can perform automated model fitting using nonlinear regression. This feature is completely flexible; users could control the list of variables to be estimated, their acceptable ranges, and could also select regression points. This feature can be applied to any model and the results obtained from the use of this method are free from human bias with quantitative information about the quality of the estimated parameter values using confidence intervals.

data validation

data preocessing

Rate Dependent Skin

The pressure loss due to turbulence and the corresponding skin factor increases with the flow rate, thus, it is rate dependent. One method to determine the rate dependency is to plot skin versus rate inorder to identify the skin without turbulence (S0) and the turbulence coefficient (dS/dQ). iTest enables users to estimate the true skin as well as the turbulence coefficient from the intercept and slope of the skin vs. rate plot.


Pseudo-pressure

In solving the diffusivity equation certain assumptions are made about the fluid properties, some of which are not applicable to gas. The viscosity and compressibility of real gases are strong functions of pressure, and it is not correct to apply the normal (slightly compressible) assumption when deriving the differential equations governing the pressure transients. For gas well test analysis, the pressure terms are replaced by pseudo-pressure (or Real Gas Potential), m(p).

iTest allows users to load an existing gas viscosity and compressibility data to be used in calculating m(p). Pseudo-pressures could also be calculated automatically using user selected correlations.

data validation

Everything you need for your next Analysis.

Here are more reasons to choose iTest: