
HYDRA
Self-Service Data Analytics
HYDRA is a centralized, web-based petroleum data analytics portal that helps consolidate and communicate facts about your business, with analytical tools for both technical users as well as decision makers. It is an E & P business intelligence platform with ease of management, full control and the security and governance needed for large-scale integration and deployment.
HYDRA is helping energy companies to turn their data into new streams of value, this can be a key differentiator where intense competition for resources and changing markets require rapid, fact-based decision making.
HYDRA is incredibly especially extremely beautiful and highly interactive.
Award winning self-service BI that allows users to run ad-hoc queries and perform data analysis, all without having to involve your organizationa€?s technical or IT staff.
Unlimited
Databases
Unlimited
Records
Unstructured
Data
All
Devices


Start getting insights into your data now using HYDRA.
Not convinced? Therea€?s all this too:
 Connect
 Blend
Blend


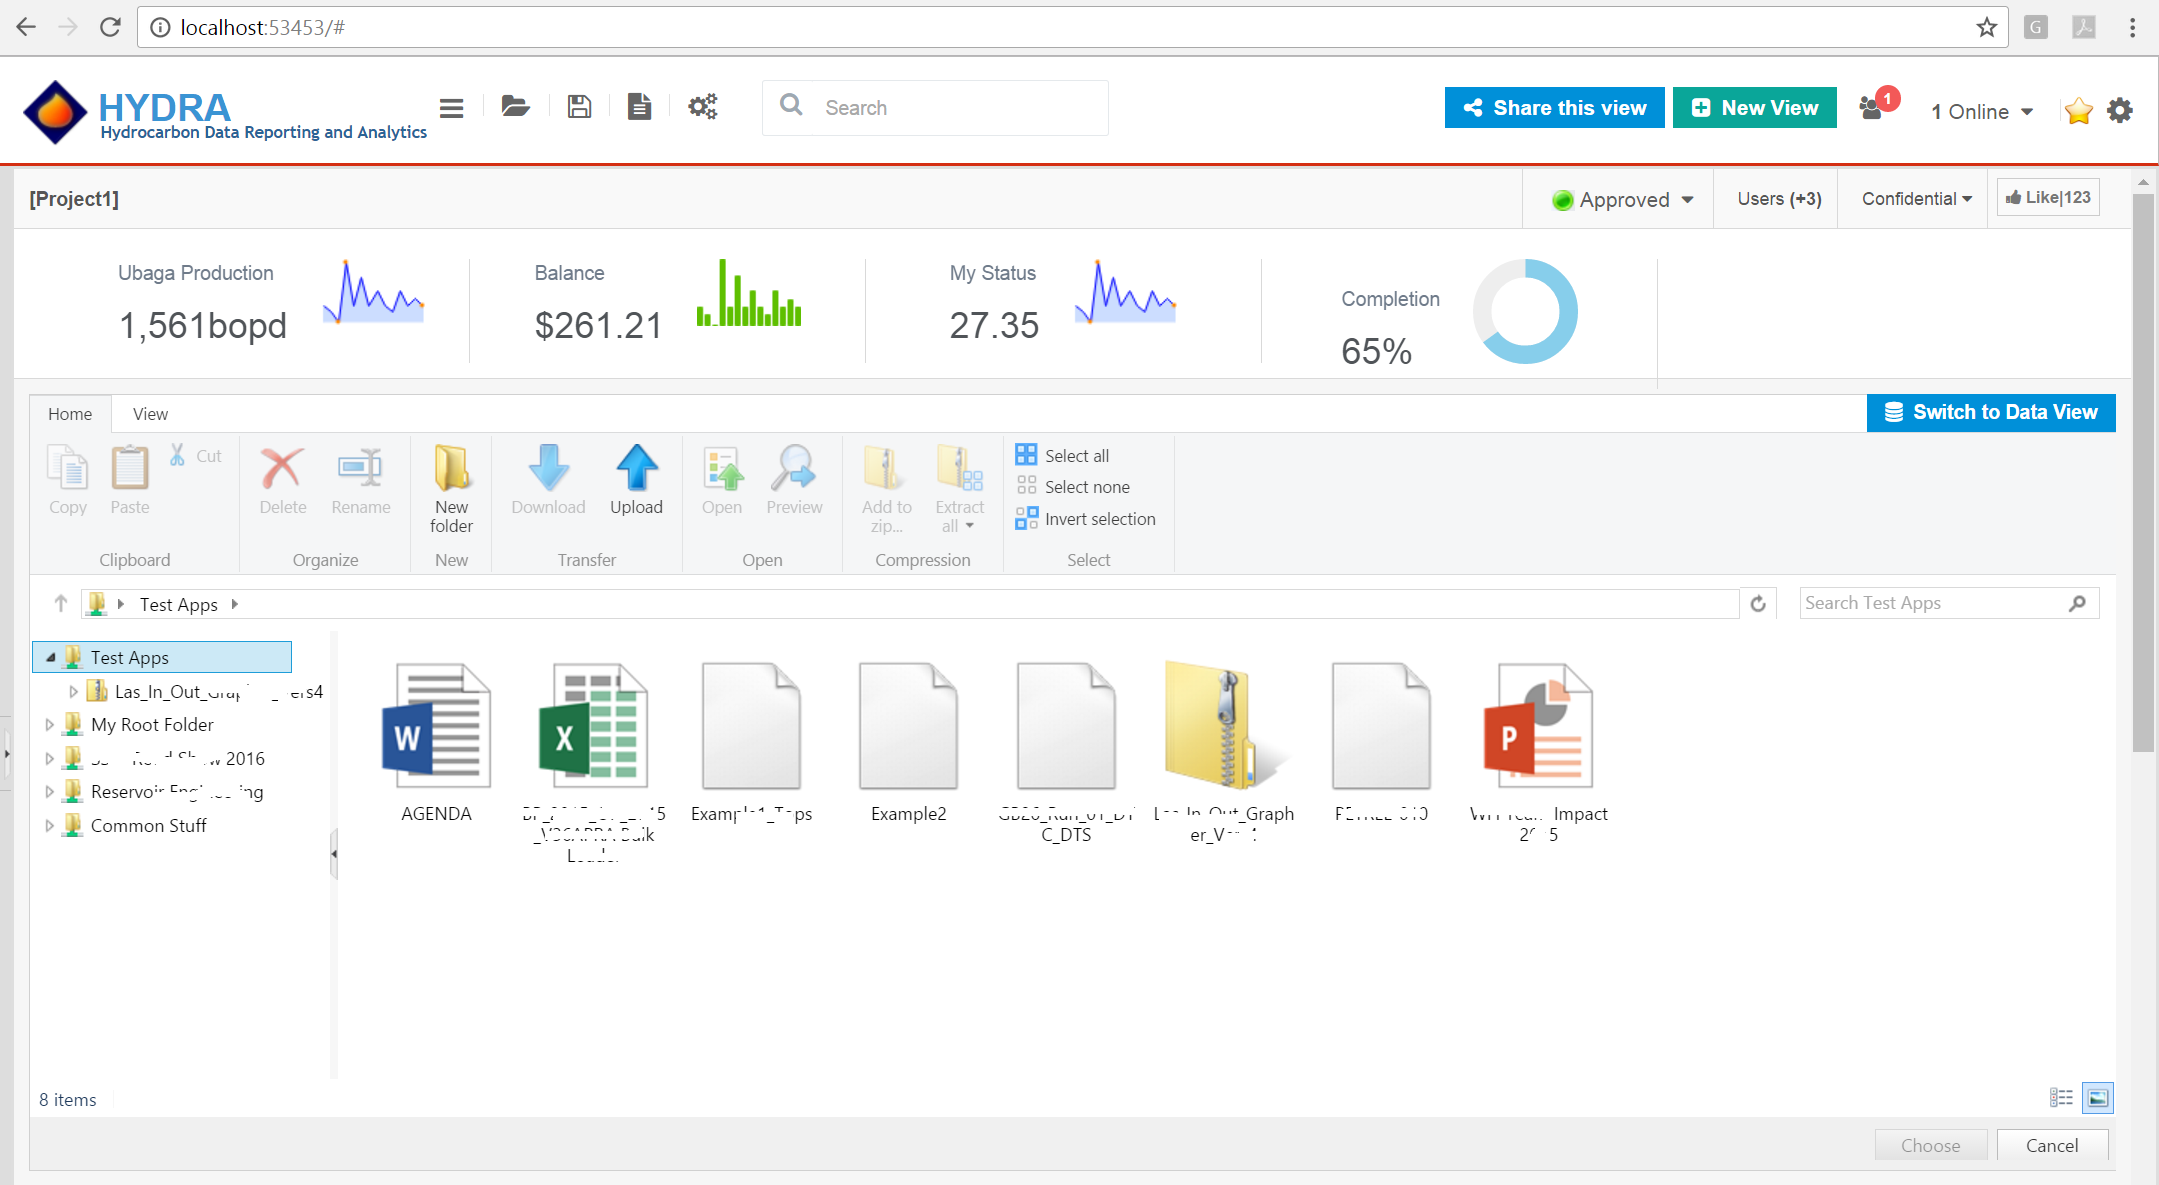
Single Point of Access
A lot of knowledge available in a company today is scattered over different sources. How many different portals, directories, databases and locations do you need to consult to get the information you are looking for? Do you know the custodians or experts to ask for data? How easy is it to find and retrieve related information?
HYDRAa€?s Single Point of Access provides consistent tools, views, actions and options across any data and all devices with the following benefits:
a€¢ Quick access to any data through a standardized, web-based browser
a€¢ One single and unified user experience independent of your data sources (Oracle, SQL Server, MS Access, OLAP, Excel, SAP, Sharepoint etc.)
a€¢ Access to data is managed from a single location, no need for multiple passwords.
a€¢ Single route for newly on-boarded staff
a€¢ Access to key validated content
a€¢ Quick links to approved templates
Data Governance & Security
Ensuring consistency and accountability is the essence of data governance. HYDRA provides data governance and centralized, controlled data provisioning for all users. HYDRA allows for the provisioning of consistent and traceable rules for calculating business quantities such as cumulative production, sales revenue, employee costs, and profit.
Security is about controlling who has access to what data. All HYDRA deployments require authentication which is handled via Integrated Windows Authentication, Password Authentication or a 3rd party Single Sign-On solution. Once the usera€?s identity is established, the issue of authorization to access different data sets is easily handled by HYDRA.


Dashboard
With the Dashboard module, you have the flexibility and control to create and customize powerful visualizations and interactive data perspectives via an easy-to-use graphical interface.
All your tables and fields with which you create your charts are available to simply drag and drop. The user-friendly interface has been purposefully designed to enhance and enable the efficient creation of charts and graphs by employing an easy-to-use drag-and-drop methodology.
Dashboard visualization types include cross tables, pivot tables, data grid, maps, text editor, images and charts (line, spline, area, areaspline, column, bar, pie, scatter, gauge, arearange, areasplinerange, columnrange and waterfall chart types). Several chart types can also be combined in one chart, enabling users to set different chart types for each series.
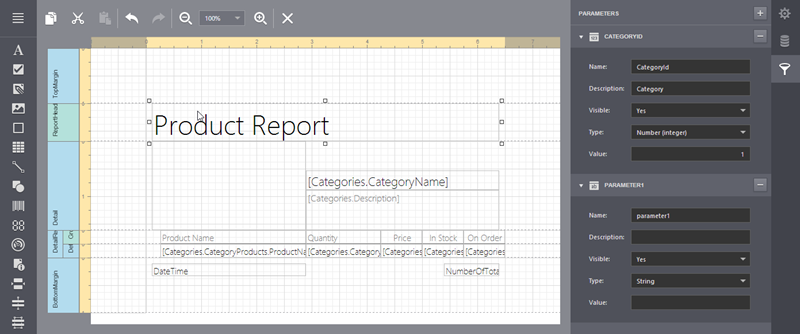
Report Designer
HYDRA ships with a powerful standalone End-User Report Designer, without which no reporting solution is truly complete. The Report Designer is open to user customization making it possible to easily convert your raw data into meaningful and expressive reports.
The dynamic Report Designer helps you overcome the limitations associated with traditional reporting solutions with a fully integrated set of productivity tools, report wizards, pre-built report templates and end-user report designers.
KPI Monitoring & Alerts
Bring your most important performance metrics out from your business systems and get them in front of your team. A Key Performance Indicator (KPI) is a measurable value that demonstrates how effectively a company is achieving business objectives and strategic goals.
When a monitored KPI is triggered, the report/chart will be exported and sent by email to pre-defined email recipients or action parties. In addition, you can define an escalation procedure if the KPI is still down after a defined period.
Optimized for Mobile Devices ...too!
HYDRA is fully responsive design, ready to look stunning on any device.
100% Responsive
HYDRA is fully responsive and will adapt itself to any mobile or tablet device.
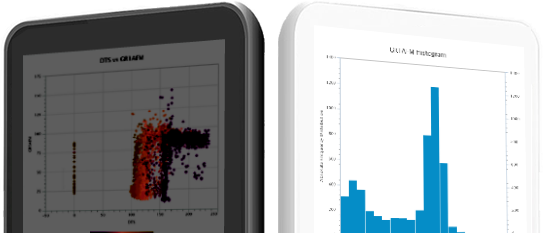
Retina Ready
HYDRA is Retina Ready and your Analysis will always look perfect on any device.
Everything you need for your next Analysis.
Here are more reasons to choose HYDRA:

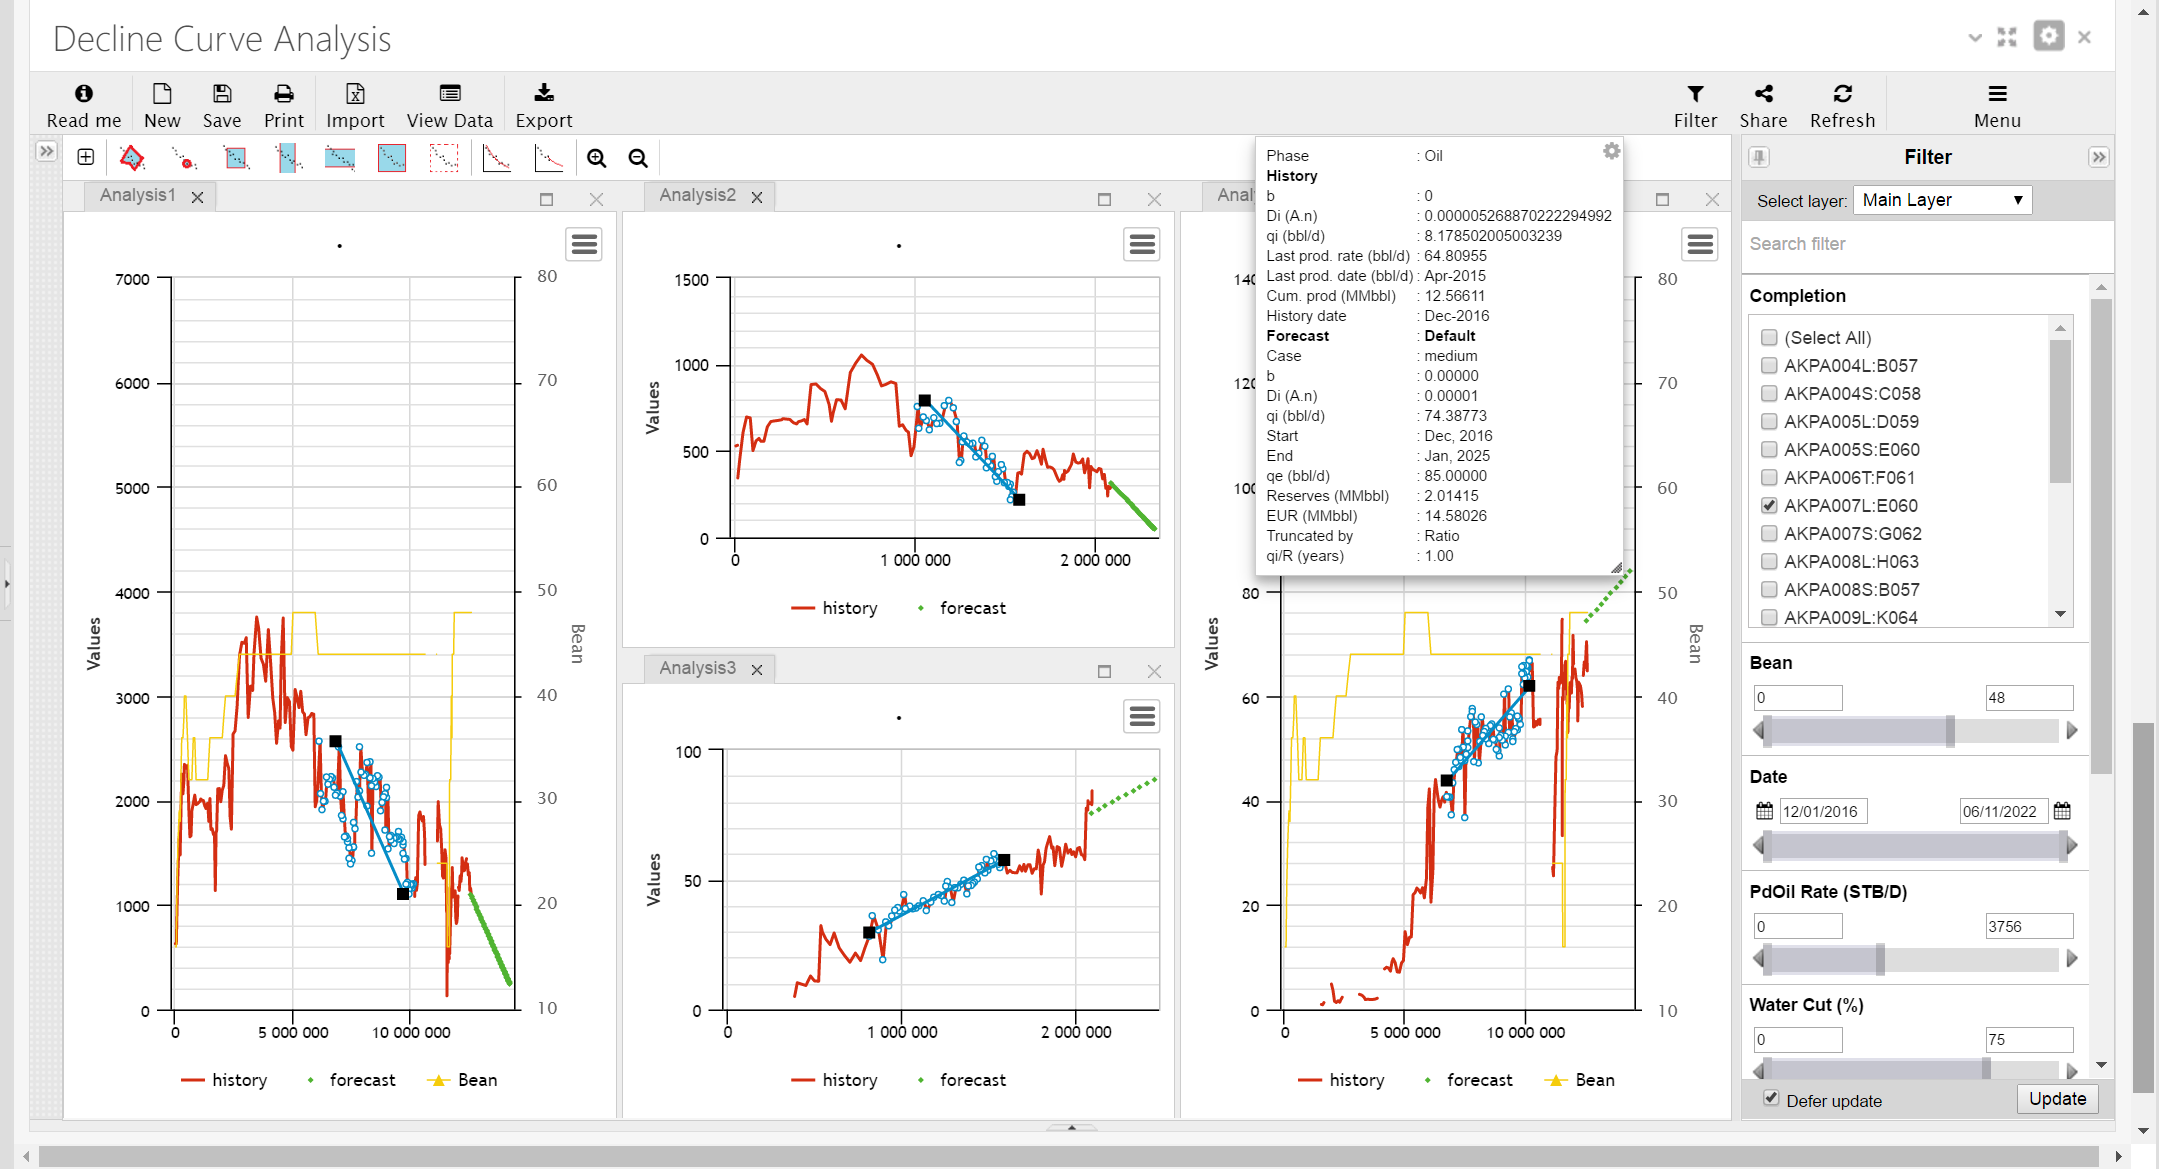
Petroleum Decline Curve Analysis
Decline curve analysis, DCA is a long established tool for developing future outlooks for oil production from an individual well or an entire oilfield. Consequently, DCA is a useful tool for analysis and forecasting crude oil production.
All common empirical decline models (Exponential, Hyperbolic and Harmonic) are available in HYDRA for fitting a decline curve to the well data and regression tools are used quickly to apply the decline curves to the wells. These simple classical decline curves are fitted to the data to predict decline rates and used in forecasting and estimating EUR.
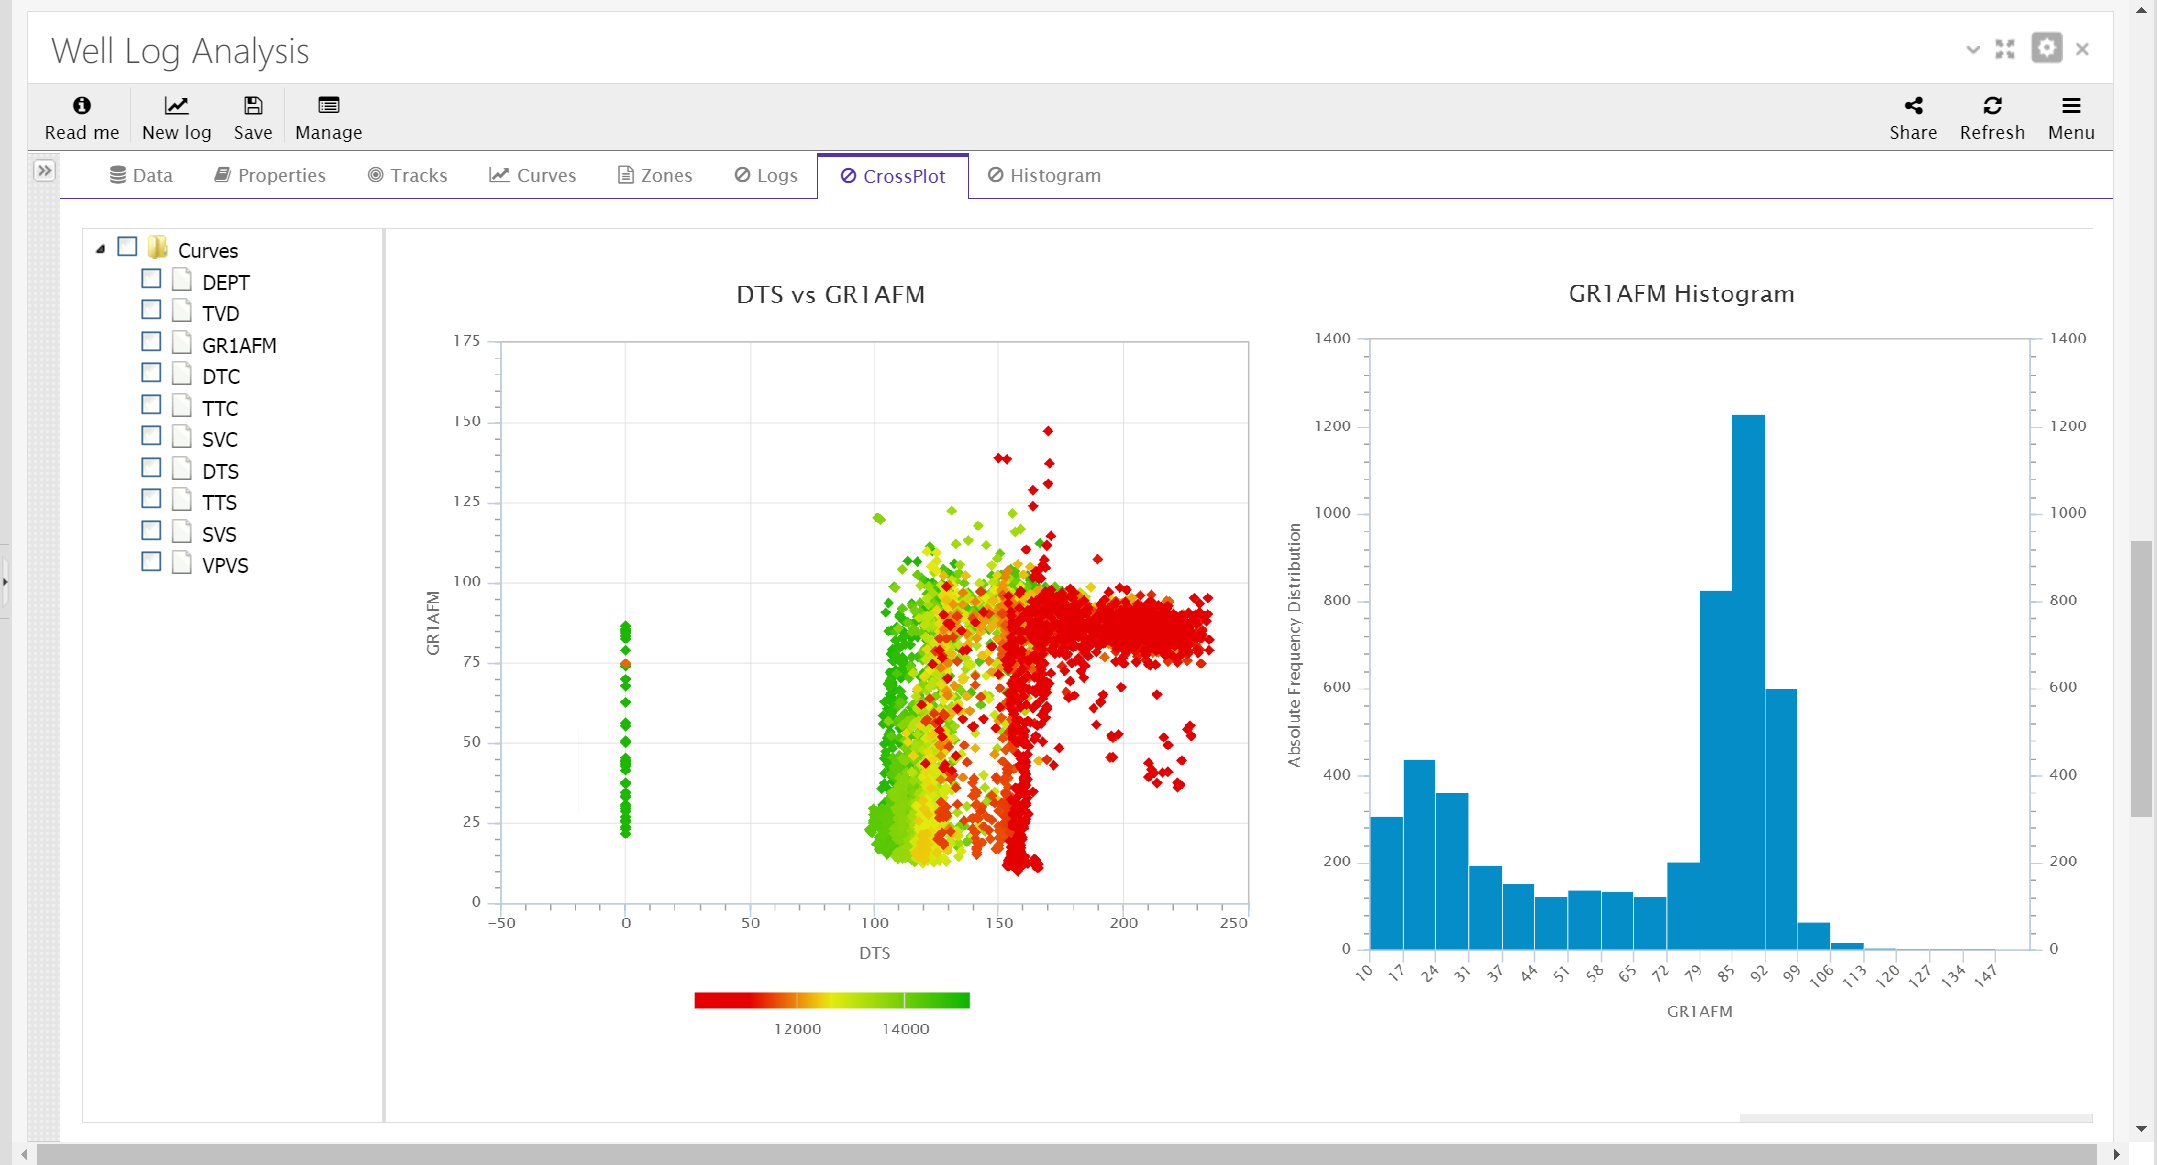
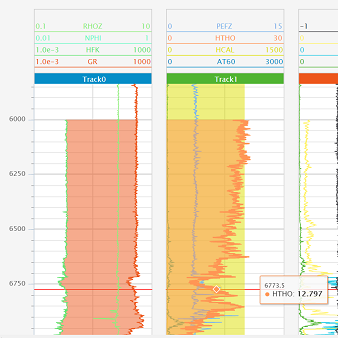
Well Log Analysis
Petrodecison have developed QuickLook Well Log Interpretation (WLI) to perform in an operational setting where communicating answers, in an environment of urgency, is essential. WLI evolved with an emphasis on speed, flexibility and output quality.
The quality of plotted output, principally log-plots, cross-plots, and cross-sections, is one of the most impressive aspects of QuickLook WLI. Using HYDRA, relationships of logging measurements to reservoir parameters can be well cataloged. WLI allows automatic calculation of commonly used parameters such as Water saturation from resistivity logs, Lithology and multi-mineral analysis, Effective porosity and shale volume

and so much more...
Industry Standard Templates
Access to standardized approved templates ensures consistency and accountability, users can quickly build and share their work in a compliant manner.
Share and Collaborate
A data-driven culture is key to every businessa€? success. Share Links, Not Data; What good are dashboards, KPIs, trends, scroecards and alerts if you can't share them with other subject matter experts in your organization? HYDRA enables users to share and collaborate on relevant data across individuals, workgroups and departments.
Multiple Datasource & Blending
HYDRA architecture allows you to blend & merge data from across different sources to create meaningful business reports. For example, combine your asset production history data in Oracle database, with your sales data from Energy Component and your asset forecast data from SQL Server, to create a report.
Units of Measure
Avoid costly mistakes in transferring data by having unit and coordinate conversions automatically done. HYDRA improves data quality by incorporating units of measure, and the ability to convert data between several units.